Where fewer apps earn more: the thin business corners of the small-app market
A small sales or security app is nearly twice as likely to make $1,000 a month as an app in the busy categories.
Like a lot of people, I can build an app. The real question is where the opportunity is, so I look at the market before I touch anything.
By the end of this you'll know which corners of the small-app market have few apps and a lot of paying ones. You'll also know how much of that is real, and how much is one big app doing the heavy lifting.
Two words first
MRR is the money an app brings in each month from subscriptions. "Making $1,000 a month" here means MRR of $1,000 or more.
The median is the middle app when you line them all up by MRR. Half earn more, half earn less.
The crowd and the corner
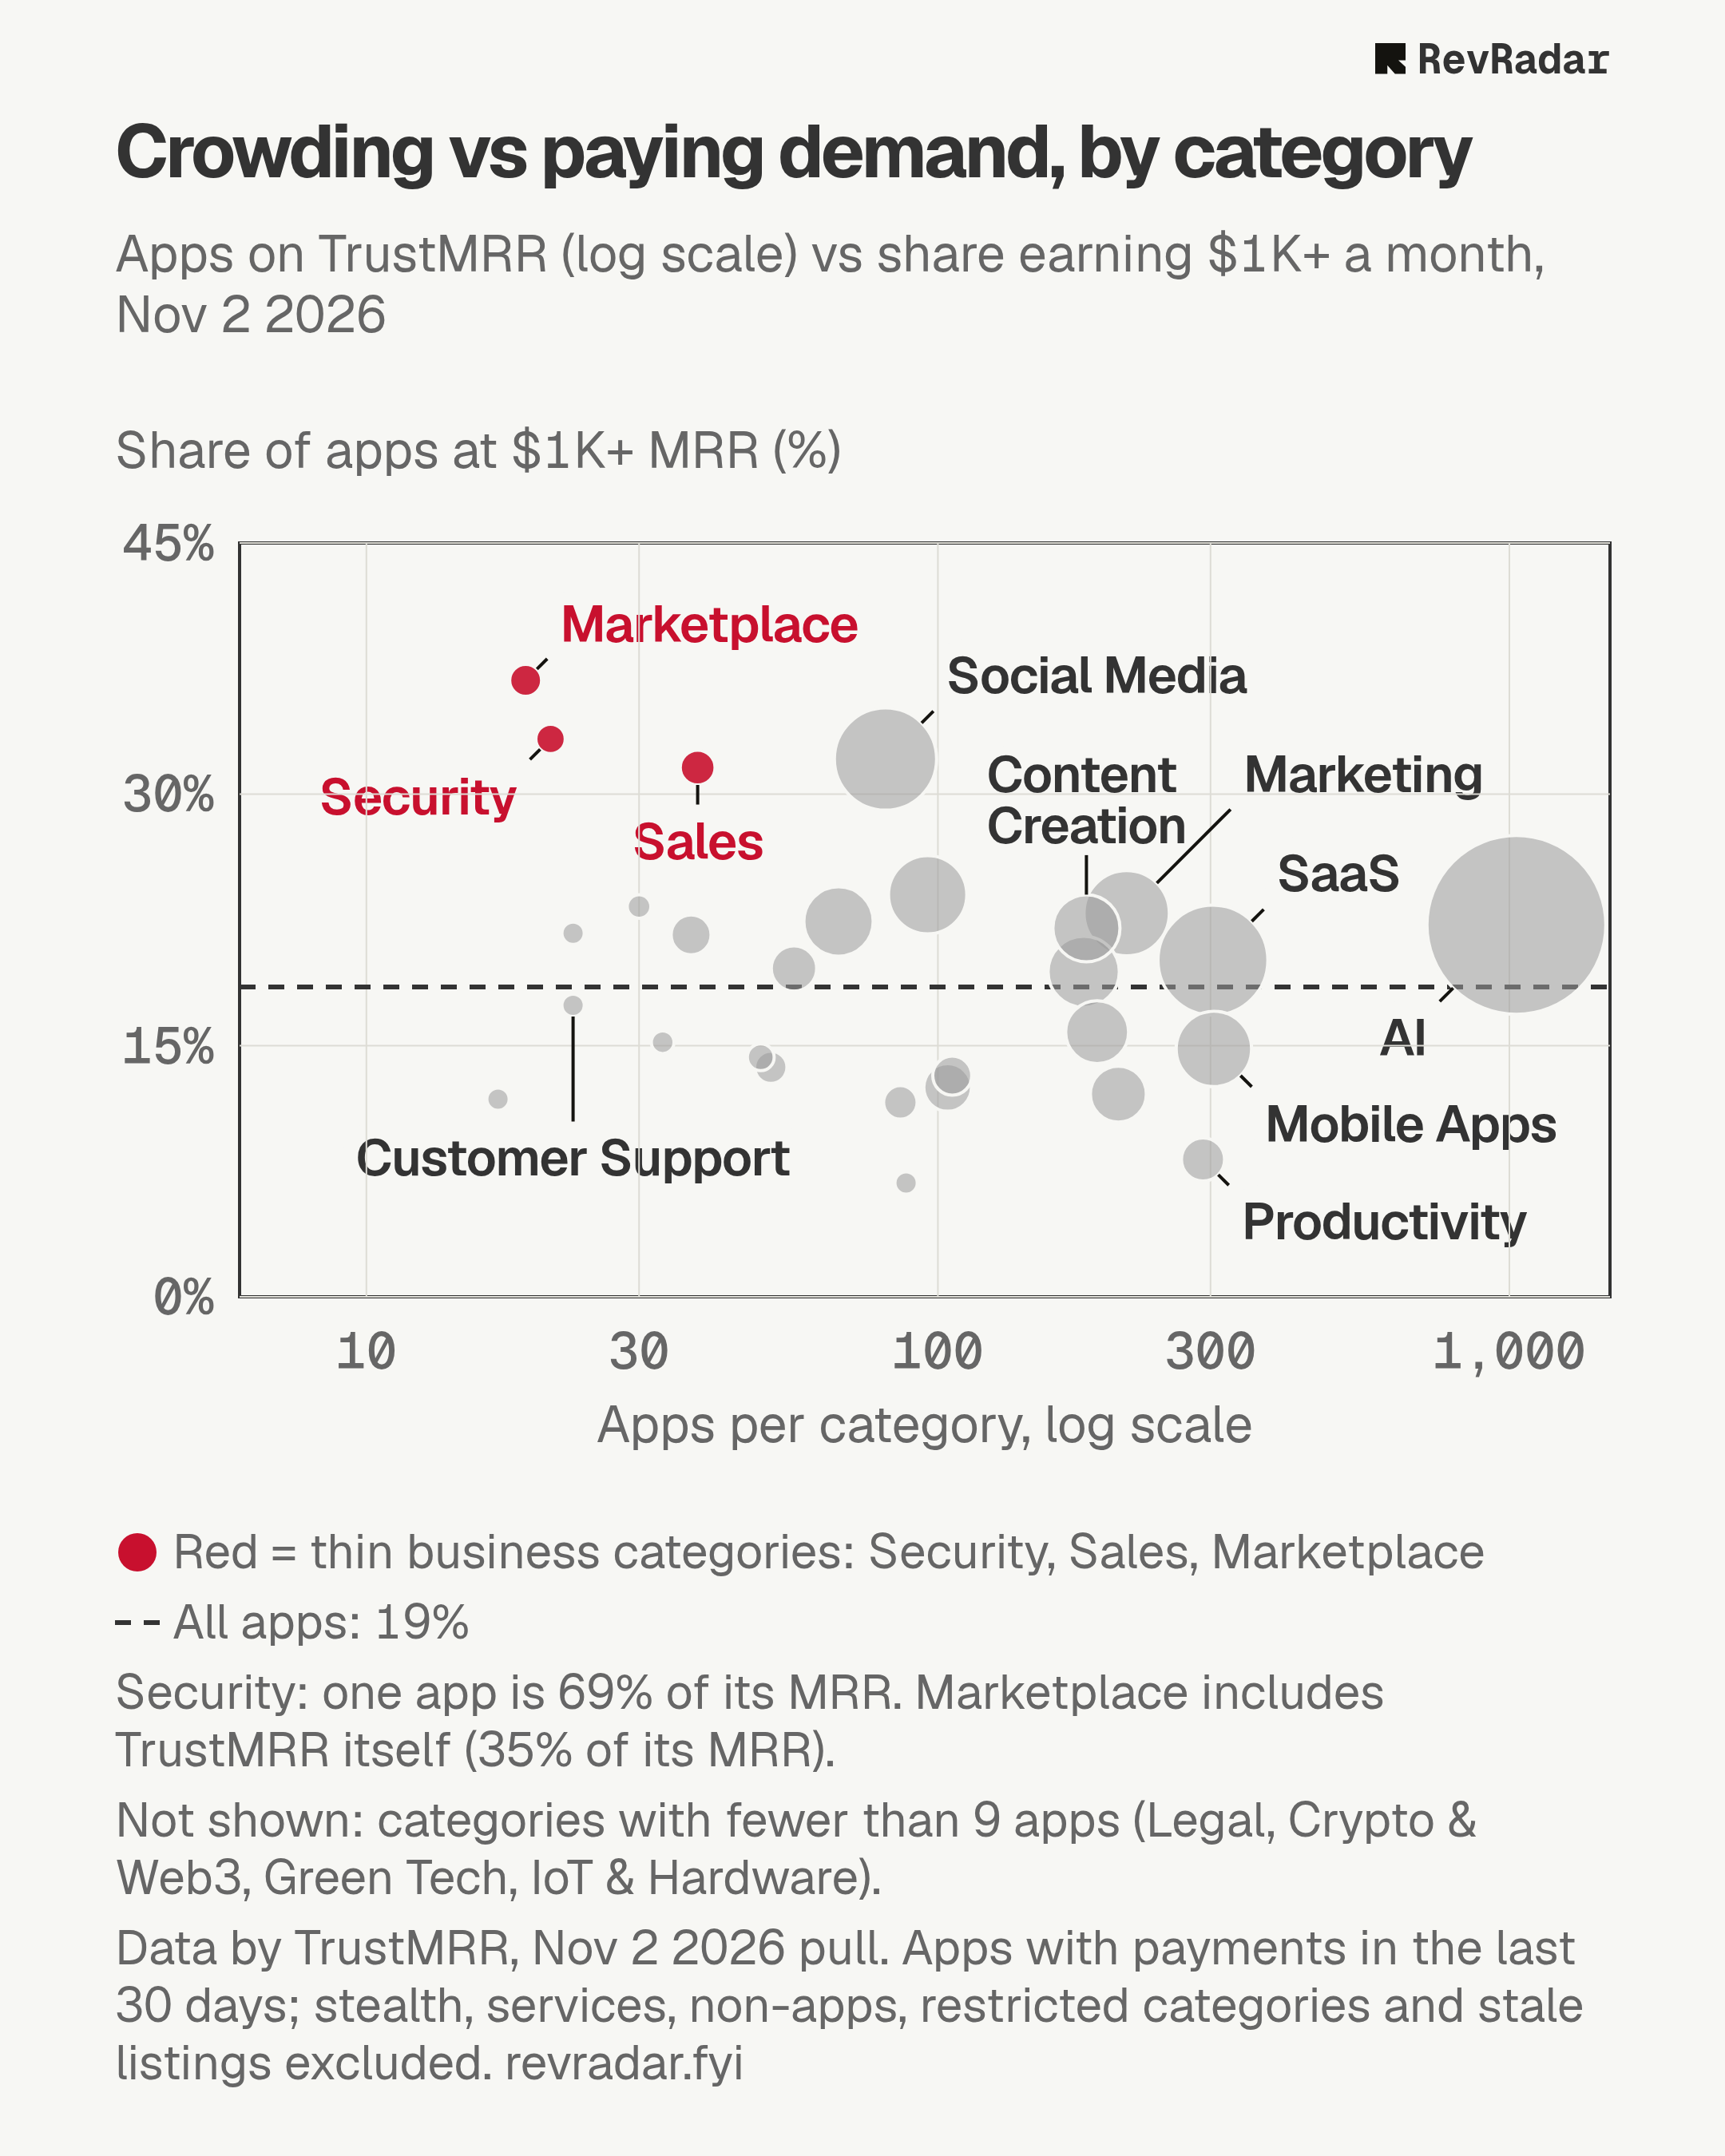
Six categories have more than 200 apps each. That's AI, SaaS, Mobile Apps, Productivity, Marketing, and Health & Fitness.
In that crowd, about 18% of apps make $1,000 a month. That's fewer than one in five. The other four make less.
Now take three small categories that sell to businesses: Security, Sales and Marketplace. Together they hold 78 apps.
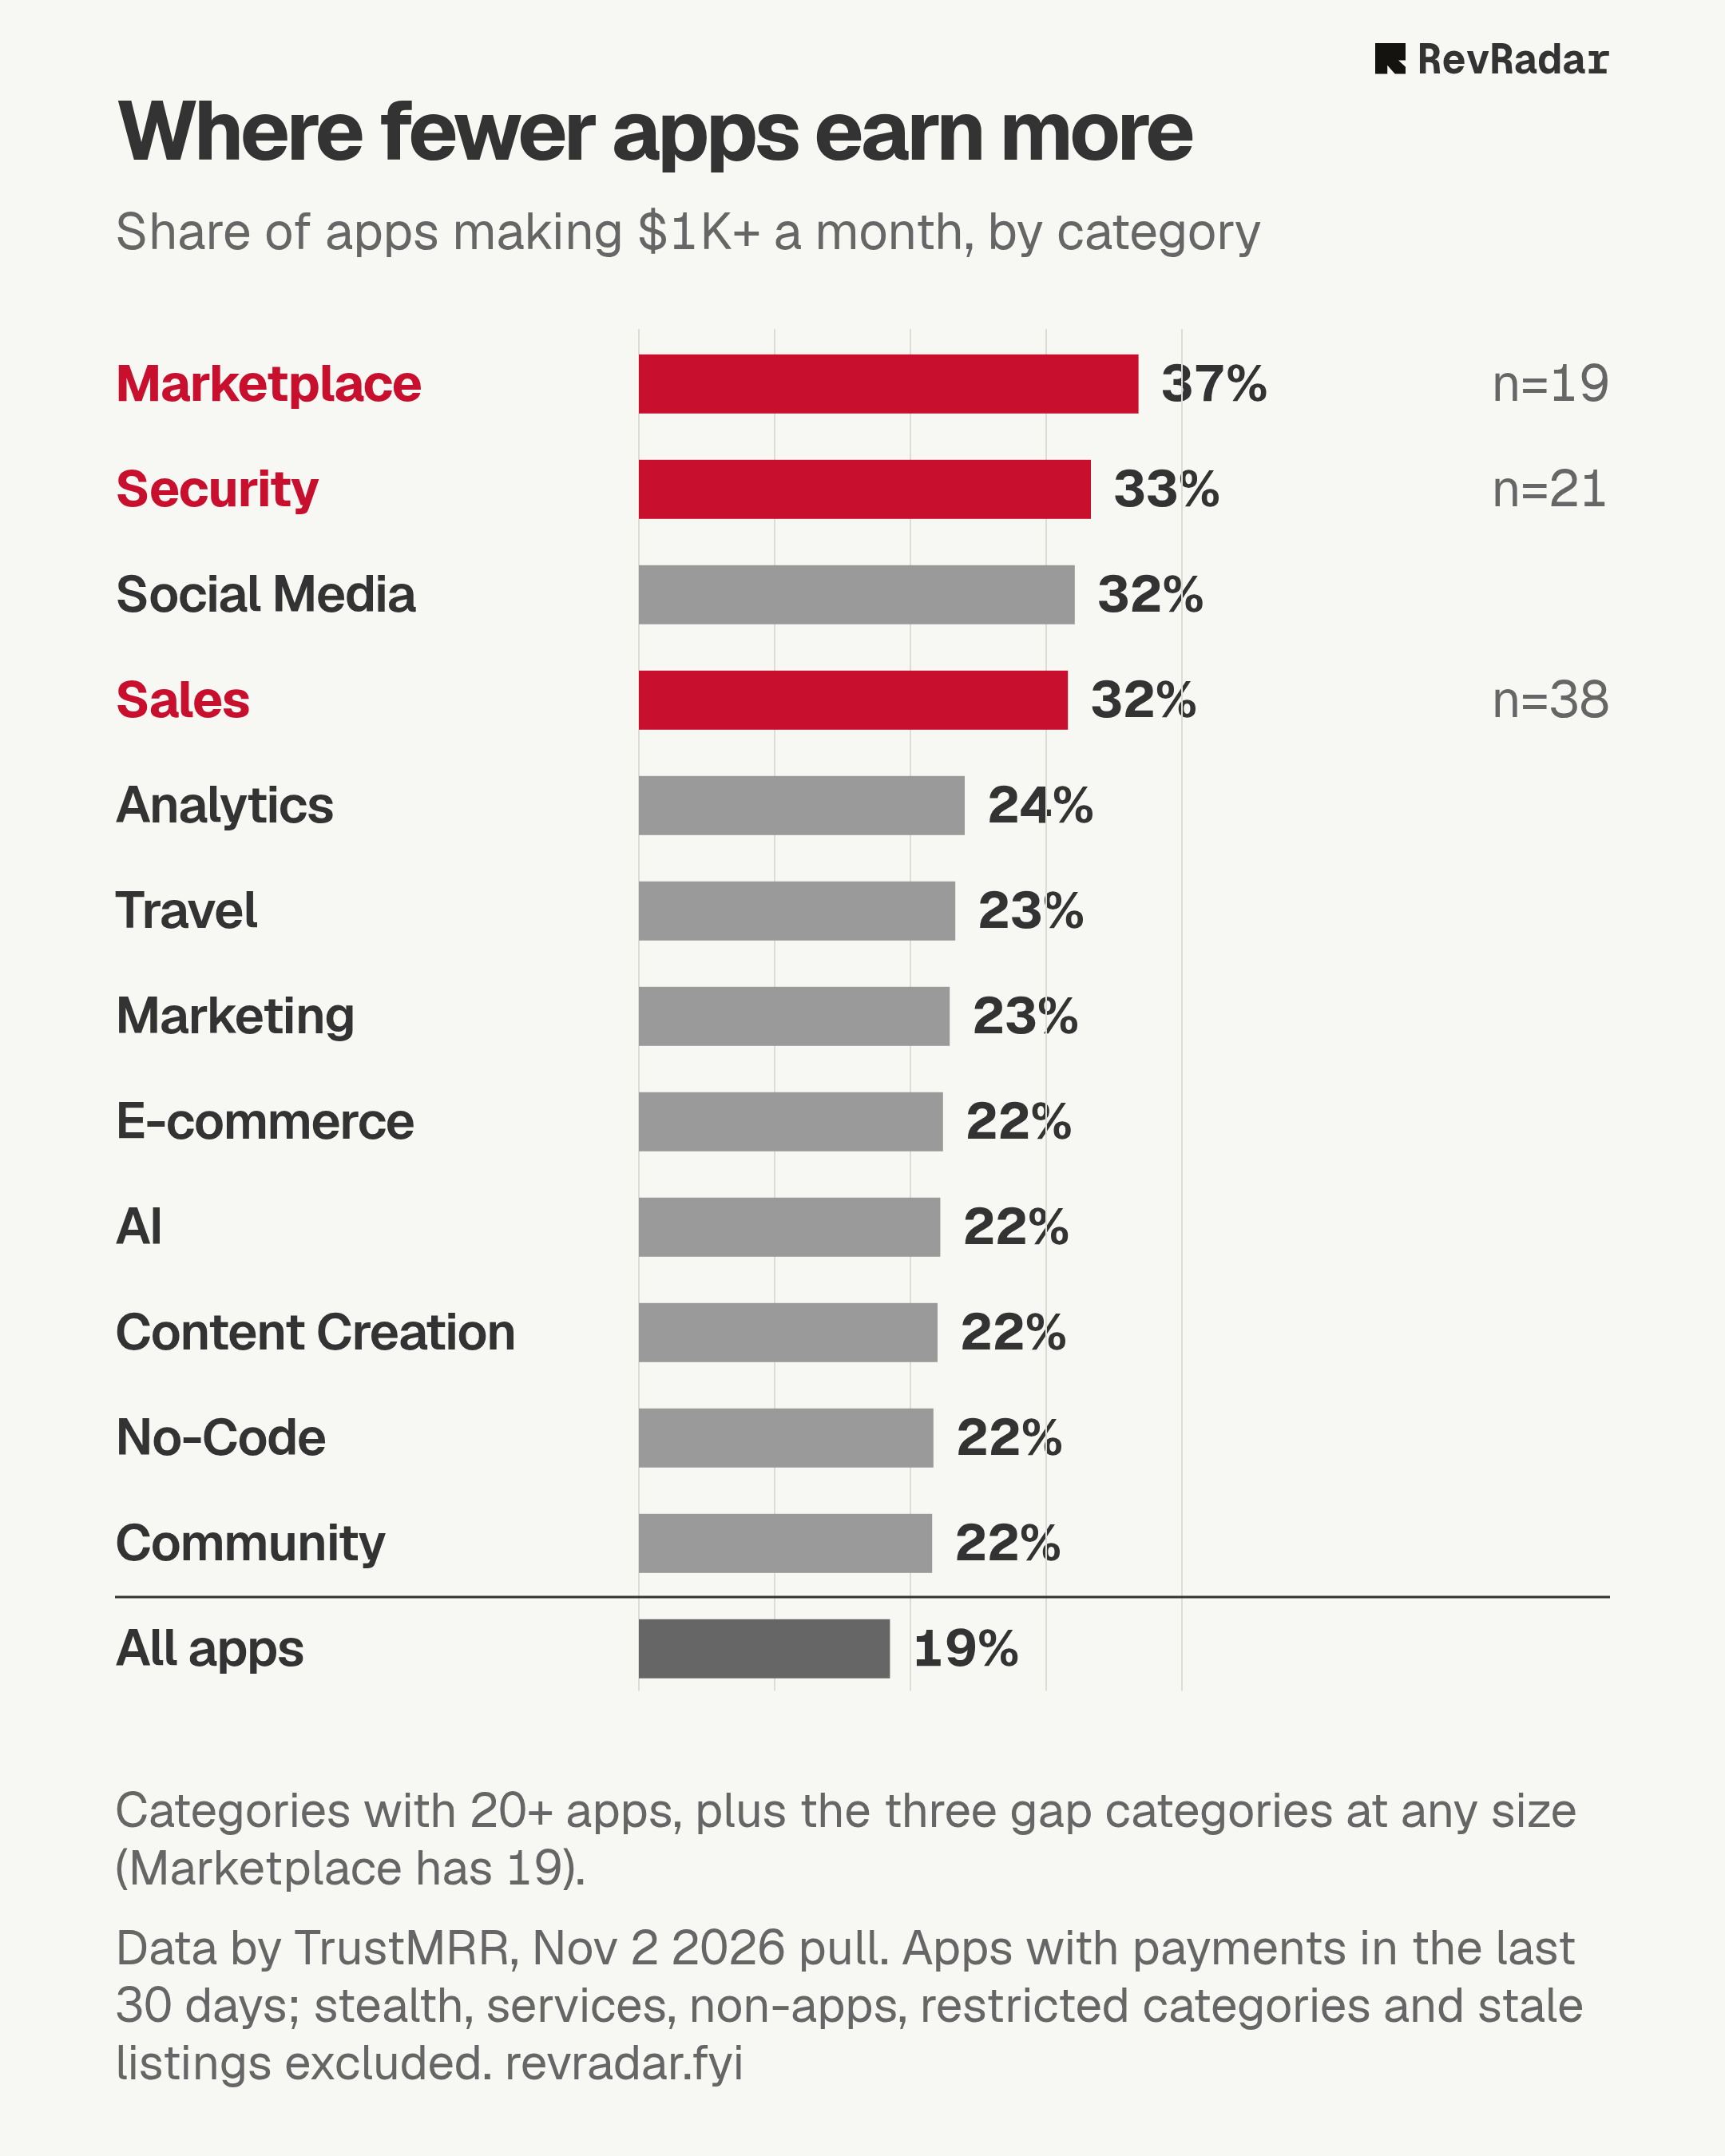
Of those, 33% make $1,000 a month. That's one in three.
Social Media gets close on share, but it's busy, not thin, so it stays out.
So an app in the small corner is nearly twice as likely to get there. (Nobody told the crowd. Or they were told and built another AI app anyway.)
Made-up example: a street with 40 coffee carts and one locksmith. Each cart fights for the same $5. The locksmith gets fewer customers, but every one of them is locked out and not haggling.
The three, one line each
Sales: 38 apps, and the middle one makes $323 a month
Security: 21 apps, and the middle one makes $807 a month
Marketplace: 19 apps, and the middle one makes $293 a month
For comparison, the middle AI app makes $156 a month. (The AI category has a lot of apps. It also has a lot of apps' worth of competition.)
Sales is the clean one
Sales has the most apps of the three, at 38.
No single sales app holds more than a fifth of the category's money. That matters, because it means the money is spread across many apps, not parked in one.
Made-up example: a school bake sale where every table sells out. That says something about the crowd. A bake sale where one table sells $900 of brownies and the rest sell nothing says something about one baker.
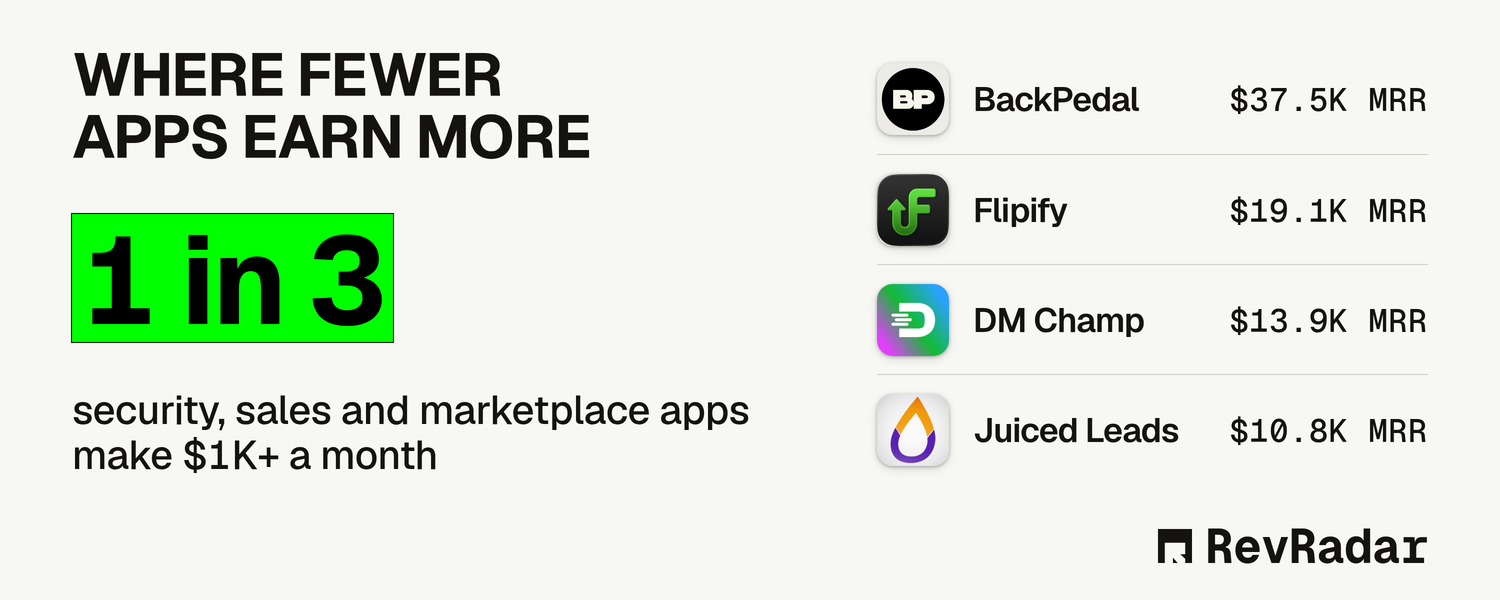
Two sales apps show what the top looks like. DM Champ makes $13,904 a month. Juiced Leads, a marketplace for sales leads, makes $10,750.
The catch: some corners are one big app
Security looks great until you check who's carrying it.
One app, BackPedal, holds about 69% of the category's money. It makes $37,507 a month.
So I ran the obvious check: take the top app out of each of the three categories.
Plenty of apps still make $1,000 a month, but the pile of money gets a lot smaller. (Still a gap. Just a more modest one, the way a "sea view" sometimes means a sea view if you lean.)
Made-up example: a class average of 80 that drops to 70 when the top student is sick. The class is still good. It just isn't all that good.
In Marketplace, Flipify makes $19,077 a month.
One more honesty note: the biggest app in Marketplace is TrustMRR itself, with about a third of the category's money. I'm counting it, but not holding it up as an example. (It would be a little odd to praise the scoreboard for scoring well.)
Big or small?
Small. The three categories are a tiny slice of all apps, and a tiny slice of all the money.
Made-up example: a quiet side street isn't a bigger market than the high street. It's just easier to get a table.
So this is a better chance per app, not a big market. And it's only within the apps listed on TrustMRR, which are founders who chose to connect their payments.
Two things readers asked
Which revenue number? The MRR reported by TrustMRR, read from the payment accounts founders connect. It's the same number for every app, which is what makes a comparison fair.
Does it last past renewals? I can't see that yet. It needs more than 30 days of history per app, so I'll come back to it.
Method
Data reported by TrustMRR, Nov 2 pull: 3,945 apps that collected payments in the last 30 days, with stealth, services, restricted categories and stale listings left out, and non-apps excluded.
"Making $1,000 a month" = apps with MRR of $1,000 or more, divided by the apps in that category. Median = the middle app's MRR.
Founders pick their own category, and categories of about 20 apps can swing with one app.
The lesson
Most people pick where to build by looking where everyone else is building. That feels safe, because a crowd looks like proof.
But a crowd is proof of interest, not proof of payment. The quiet corners don't get talked about, so nobody notices they're paying.
The money tends to sit where the attention isn't.
So, pick a side: would you rather build the 39th sales tool, or one more AI app?